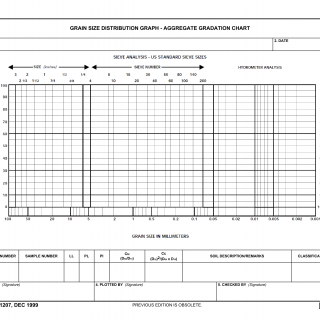
DD Form 1207. Grain Size Distribution Graph-Aggregate Gradation Chart
DD Form 1207 - Grain Size Distribution Graph-Aggregate Gradation Chart is used to graphically represent the grain size distribution of soil or aggregates. This information is crucial for construction and engineering projects.
The form consists of a graph where users plot the percentage passing on the y-axis against the sieve size on the x-axis. The graph allows visualization of the grain size distribution of the soil or aggregates.
Important fields in this form include the sieve sizes and the corresponding percentages passing. Accurate plotting and labeling are important for the graph to accurately represent the data.
Application Example: Engineers use DD Form 1207 to visualize and communicate the grain size distribution of soil or aggregates, which helps determine suitability for construction purposes.
Related Form: DD Form 1206 is related, as it is used to document the actual measurements of the grain size distribution using the sieve method.
Alternative Form: ASTM C136 is a standard test method used to determine the particle-size distribution of fine and coarse aggregates using a similar gradation chart.

