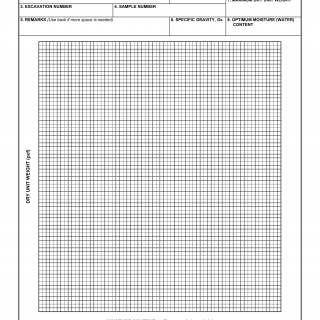
DD Form 1211. Laboratory Soil-Compaction Test Graph
DD Form 1211 - Laboratory Soil-Compaction Test Graph is used to graphically represent the results of laboratory soil-compaction tests. This graphical representation helps visualize the compaction characteristics of the soil.
The form consists of a graph where users plot the moisture content on the x-axis and the dry unit weight on the y-axis. The graph allows for the visualization of the compaction curve, which is crucial for understanding soil compaction properties.
Important fields in this form include the moisture content and dry unit weight. Accurate plotting and labeling are important for the graph to accurately represent the compaction characteristics.
Application Example: Engineers and geologists use DD Form 1211 to graphically present and analyze the results of soil compaction tests, aiding in evaluating soil suitability for construction.
Related Form: DD Form 1210 is related, as it involves the recording of soil compaction test data.
Alternative Form: ASTM D1557 is a standard test method used for determining the laboratory compaction characteristics of soil using modified proctor compaction test and similar graphical representation.

